
Introduction
In the rapidly evolving world of 5G Non Terrestrial Networks (NTN), visualizing how LEO satellites interact with Earth-bound User Equipment (UE) is a complex challenge. Whether you are a telecommunications engineer, a student, or a space enthusiast, understanding the physics behind these connections is vital.
To help demystify these concepts, I have developed the 5G-NR NTN Link Budget Emulator, a real time, browser based simulation tool.
Why I Built This Tool
My primary motivation for building this project was self study. As NTN technology becomes a cornerstone of global connectivity, I wanted to move beyond theoretical papers and formulas. I needed a way to see how orbital mechanics, signal propagation, and Doppler shifts interact in real-time. By building this tool, I was able to bridge the gap between abstract mathematical equations and the dynamic reality of satellite communication.
Understanding the Inputs: The Variables of Space
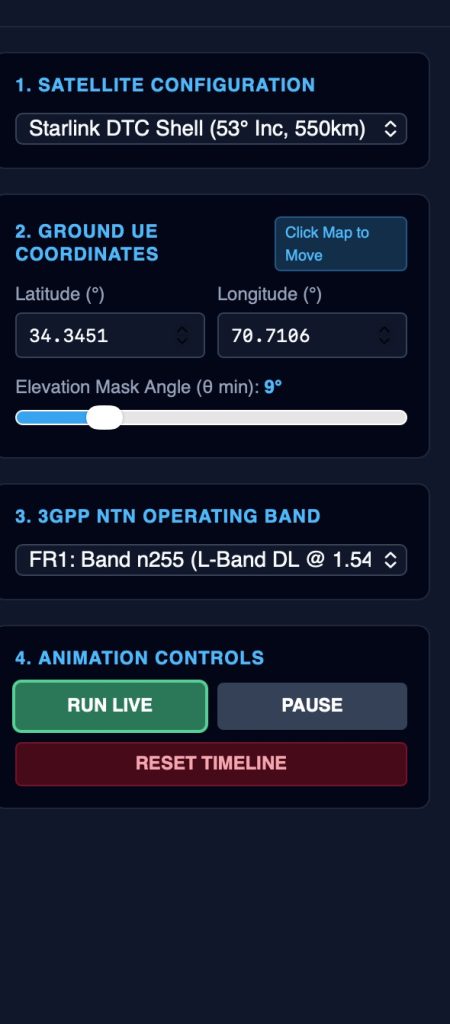
The emulator allows you to configure your simulation environment using several key parameters:
- Satellite Configuration: Choose between pre defined orbital shells (Starlink, OneWeb, or Equatorial). Each has unique inclinations and altitudes, which significantly change how the satellite "passes" over your location.
- Ground UE Coordinates: By clicking the map, you can place your UE anywhere on the globe. This determines the slant range and the specific geometric relationship between your station and the satellite.
- Elevation Mask Angle: This acts as your "horizon filter." It instructs the emulator to ignore any satellite signals arriving below a certain angle, simulating the real-world impact of terrestrial obstructions (like buildings or terrain) and atmospheric degradation.
- NTN Frequency Band: You can toggle between FR1 (L/S-Band) and FR2 (Ka-Band). This input is critical, as it directly impacts the calculation of Doppler Shift, which is much more pronounced at higher frequencies.
Interpreting the Outputs: Turning Data into Knowledge
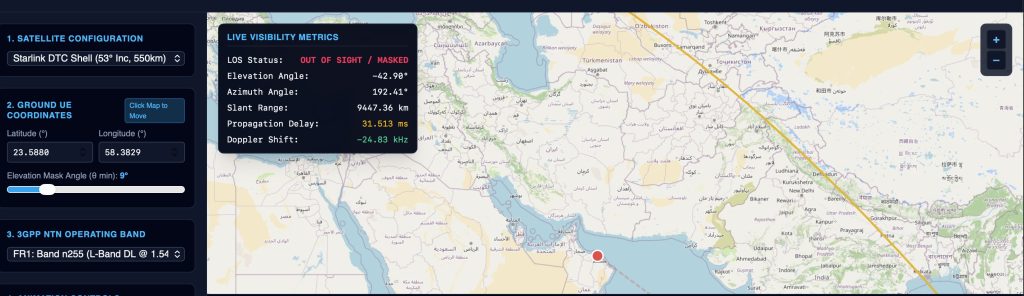
The dashboard provides a real time HUD and analytical charts to help you track the "health" of your link:
- Line-of-Sight (LOS) Status: Tells you instantly if the satellite is reachable or currently masked by your configuration.
- Propagation Delay: Displays the time it takes for a signal to travel the slant range. This is essential for understanding the latency challenges in NTN.
- Doppler Frequency Shift: Tracks the frequency error caused by the satellite’s high velocity relative to your position. Observing this helps you understand why 5G-NR requires advanced synchronization techniques.
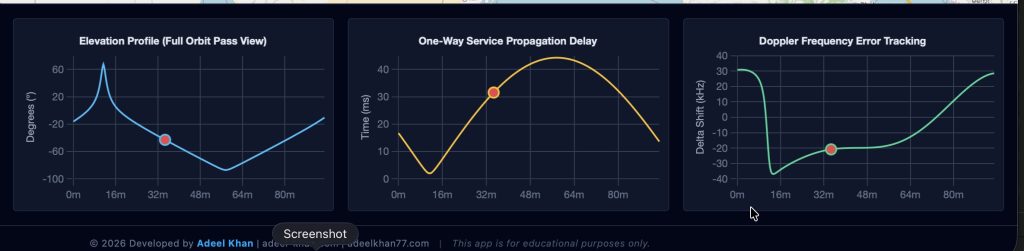
- Analytics Charts: The bottom charts visualize the full orbit pass. By watching the red "sweeper" dot move across the elevation, delay, and Doppler profiles, you can see how these values peak and drop during a single pass.
Why Just One Satellite?
You might notice that the emulator tracks a single satellite rather than a full constellation. This was a deliberate choice for educational clarity.
Modeling a full constellation involves managing handover logic, complex inter-satellite links (ISL), and dense signal interference, which can obscure the fundamental physics. By focusing on a single satellite, we can isolate the core variables, elevation, range, and Doppler, to build a rock-solid foundation of understanding. Once you master the link budget of one, you have the knowledge to scale your understanding to entire constellations.

Join the Journey
This project is open source. I encourage you to use the tool, explore the code, and perhaps even modify it to add new features!
Link to run the tool online: https://adeelkhan-learning.github.io/NTN-Link-Simulator/
Link for the tool repository: https://github.com/adeelkhan-learning/NTN-Link-Simulator/tree/main
This tool is intended for educational purposes. I look forward to hearing your feedback and seeing how you use it in your own research!