
Introduction
Managing a stock portfolio on the Pakistan Stock Exchange (PSX) usually involves a lot of manual friction. Every trade, dividend, and fund transfer generates a rigid PDF or an unformatted email. For years, keeping my portfolio tracker accurate meant manually copying data into an Excel sheet to figure out my true cost basis, taxes, and realized profits.
Coming from a telecommunications engineering background, I have zero tolerance for repetitive manual data entry. I wanted a modern, automated solution. So, I decided to build my own end to end FinTech pipeline using Python, Vision AI, and Streamlit. The input files used for this process are received in form of PDF or email.
Part 1: The Automated AI Extractor
The first challenge was getting the data out of messy broker PDFs. Traditional OCR (Optical Character Recognition) struggles with misaligned tables and complex broker extensions (like -READY or -OCT).
Instead of fighting OCR, I built an extraction engine using Groq's Llama 3 Vision AI.
- Vision Processing: A Python script uses
PyMuPDFto convert the PDFs into high-res images and sends them to the Vision model. This extracts the exact printed taxes, quantities, and net values from the tables. - Deterministic Cleaning: AI can sometimes hallucinate. So I built a strict Python safety net using Regex to strip away messy broker extensions. It mathematically verify the AI’s output against the grand totals.
- The Database: The script automatically logs everything into a centralized
PSX_Portfolio_Tracker.xlsxdatabase, ensuring no file is ever processed twice. - Workbook Sheets: it creates 4 workbook sheets based on the provided inputs from the folders. Trade_Confirmations (All PDF received from broker of bought stocks / ETF) For IPO it accepts email is text file. Funds_Transfers (Emails received converted to text file). Dividends (Dividend warrant received in form of PDF). Processed Files (Contains the confirmation of the file extracted so it will not duplicate).
Part 2: The Interactive Streamlit Dashboard
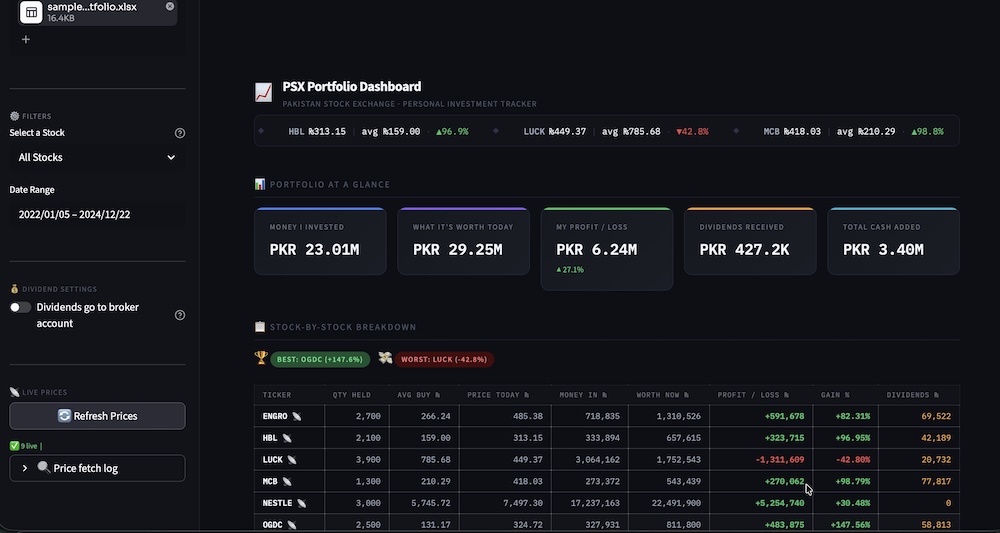
Having a clean ledger is great, but visualizing it is where the real value lies. I built a custom Streamlit web application to act as my personal financial terminal.
- Advanced Analytics: It calculates portfolio growth, maps asset allocation, and features a running cash-flow balance that tracks deposits, withdrawals, and locked-in profits from closed positions.
- Top Ticker: Shows the current stock price and average price of stock I bought and calculates if its in positive or negative trend.
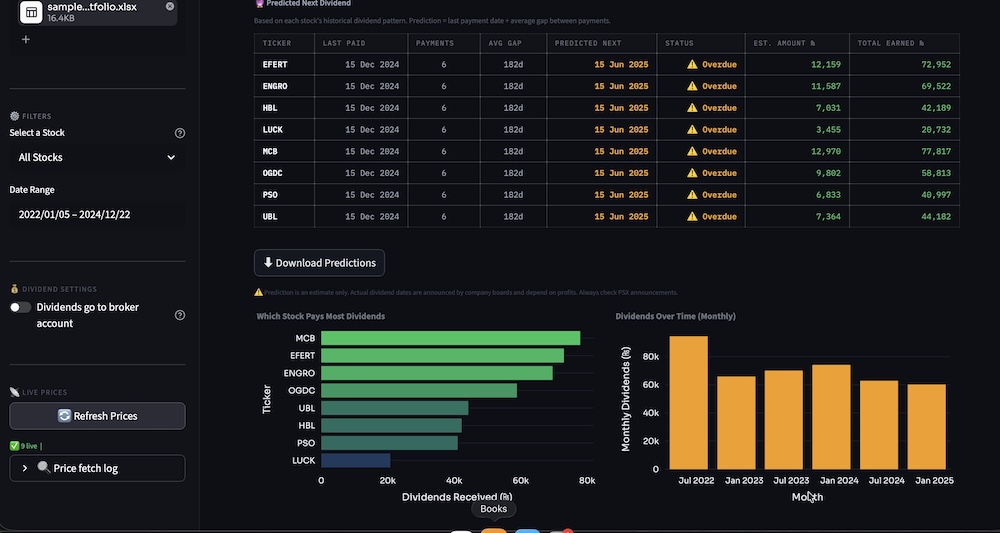
- Dividend Intelligence: It doesn't just track past dividends; it analyzes historical payment gaps to predict when my next dividend payments are due.
- Deep Dives: By clicking on any active holding, the dashboard plots my exact buy, sell, and dividend dates directly onto the live price chart using Plotly.
The Result
I now have a zero touch portfolio manager. I drop my broker PDFs into a folder, run my scripts, and instantly get a professional grade, live updated dashboard of the values of stocks at that particular moment. There is button to refresh its values afterwards if required.
I’ve open sourced the entire codebase on GitHub. If you're tired of manual spreadsheet updates or interested in seeing how AI Vision models can handle complex tabular data, check out the repository below!
https://github.com/adeelkhan-learning/psx-portfolio-terminal